BLOG
2022.04.04
The move toward decarbonization is accelerating with a green recovery strategy as a major pillar of a post COVID-19 pandemic economic recovery. Following COP 26, which was held at the end of October 2021, and countries announcing a series of policy targets for decarbonization, the move towards green strategies is likely to continue. Electric vehicles (EVs) are expected to play a major role in this move toward decarbonization. In this blog, we will look at the production status and trade patterns of EVs.
Worldwide EVs Sales
According to an IEA report, the number of global EV fleets (including BEVs* (battery electric vehicles) and PHEVs** (plug-in hybrid electric vehicles)) worldwide, as of the end of 2020, was approximately 10 million. Despite a 16% decrease from a year earlier in 2020 in overall global vehicle sales due to the COVID-19 pandemic, EV sales actually increased by 50% to approximately 3 million (4.6% of the total). Thanks in part to aggressive subsidy policies of individual countries, Europe overtook China in 2020 to become the world's largest EV market for the first time. Looking at the breakdown, Europe (mainly the UK, France, and Germany) leads with 1.4 million, followed by China in second place with 1.2 million and the United States in third place with 295000. Stocks of electric buses and trucks also expanded, reaching 600,000 and 31000, respectively.
*BEVs: Vehicles that run entirely on electricity
**PHEVs: Vehicles that can run on both gasoline and electric power
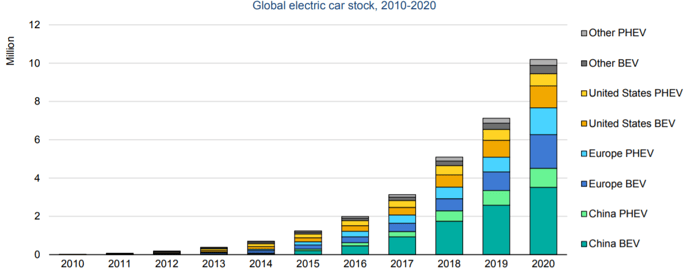
Global Electric passenger car stock, 2010-2020
(Source) IEA Global EV Outlook 2021
Future Prospects for EV Popularization
In the first quarter of 2021, global EV sales were approximately 500,000 in China and 450,000 in Europe, an increase of approximately 140% compared to the same period in 2020. Sales in the United States doubled from a year earlier. Although the figure seems to indicate a significant increase for the United States, sales volume was approximately 100,000 which is lower than that for China and Europe.
In the IEA's Stated Policies scenario, EV stocks for all modes (excluding motorcycles and tricycles) is expected to reach 145 million vehicles by 2030, representing a 7% share of the vehicle market. Furthermore, in the case of Sustainable Development Scenario (SDS) in which governments accelerate their efforts to achieve climate change targets, the global EV stock in the world is expected to reach 230 million (excluding motorcycles and tricycles) by 2030, representing 12% of the vehicle market.
Now that we have looked at the current major sales areas (China and Europe), I would like to mention Japan. In Japan, the Ministry of Economy, Trade and Industry (METI) has set a goal of “100% EV for new passenger car sales at the latest by the mid-2030s for the automotive industry and storage battery” in its “Green Growth Strategy Through Achieving Carbon Neutrality in 2050” which was formulated at the end of 2020. Based on this goal, it is estimated that BEVs and PHEVs will make up 20 to 30% of vehicle sales in Japan by 2030.
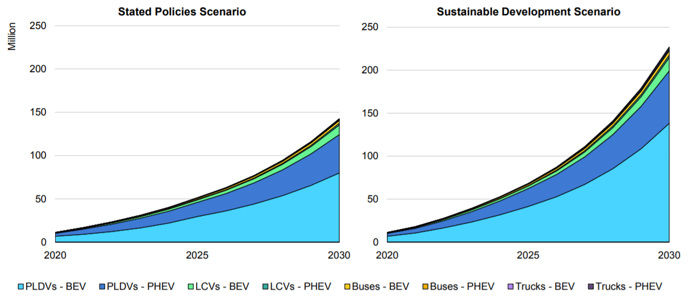
EV diffusion scenario
Source: IEA Global EV Outlook 2021
Sales of individual EV manufacturers
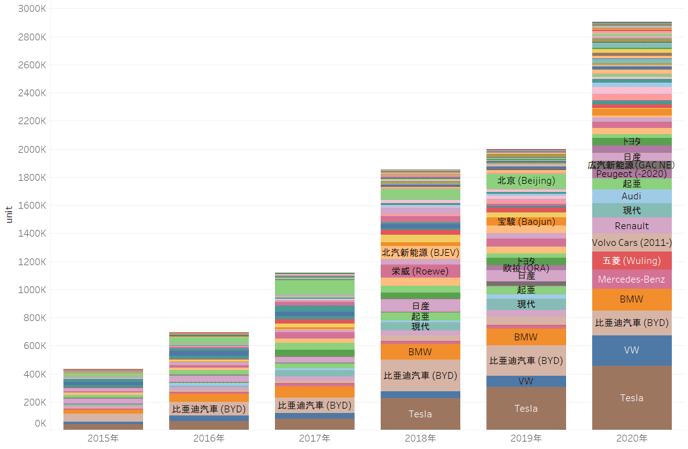
In terms of sales of EVs by each manufacturer in 2020, Tesla held on to its top spot with about 500,000 sold, far ahead of second place. Model 3 continued its strong sales from the previous year. Model Y, which was launched in 2020, ranked fourth in annual sales. As a result, sales for the full year of 2020 (January-December) rose 28.3% compared to a year earlier, reaching $31,536million (approximately ¥3,327.2 billion).
Volkswagen (VW) came in second place with sales of about 210,000, followed by BYD in third place with sales of about 170,000. The rise of European manufacturers was noticeable, with European manufacturers such as Mercedes and Audi, which were not in the top 20 in 2019, newly making the list, and European brands such as VW and BMW, which were originally on the list, making steady gains in sales. On the other hand, Asian brands such as Nissan Motor Co., Ltd., SAIC Motor Corporation Limited of China, and Hyundai Motor Company of South Korea all lost market shares. (Recently, Asian manufacturers have announced new EV sales strategies one after another, so it will be interesting to see how their market share changes in the future.)
Sales share of major EV manufacturers
Source: MarkLines
By type of car, the world’s best-selling EV in 2020 was Model 3 from Tesla, with sales of 350,000. The “HongGuang Mini EV” from SAIC-GM-Wuling Automobile, which attracted attention for its low price of approximately 500,000 yen, came in second with sales of around 120,000. In China, the world’s biggest EV sales market, the type of car in first and second place was the same as the world sales above, and Renault’s “ZOE” was in third place with sales of approximately 100,000.


Tesla Model 3 (above) and No. 2 “the Hongguang Mini EV” (below)
The Model 3 is priced at about 4.44 million yen and the MINI EV at about 500,000 yen.
Source: Company Website
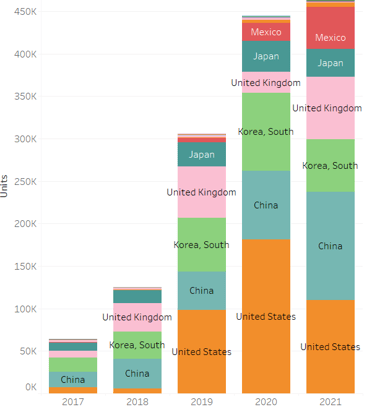
EV Sales Rank by Country
As shown in the chart below, China is in first place in terms of sales by country, with approximately 1.2 million, far ahead of the rest of the world. In China, with the exception of Tesla, most of the best sellers are concentrated among domestic manufacturers. In particular, as mentioned above, the Hongguang MINI EV, which came in second place in sales, has become a popular model due to its affordable price and performance despite its small size.
Sales in China surged in 2018. The reasons behind this include (1) tax exemptions on the purchase of new energy vehicles, (2) increased demand in cities which have implemented number registration regulations, such as Beijing, Shanghai and Tianjin, and (3) the growing introduction of commercial vehicles in the public transportation sector.
Outside of China, Germany overtook the United States to take second place in 2020. Other European countries such as the UK and France are also significantly increasing their market share. This can be attributed to environmental regulations in Europe* and government subsidies for EVs.
*EU regulations require new passenger cars to reduce their carbon dioxide (CO2) emissions to 95g per kilometer driven since 2020.
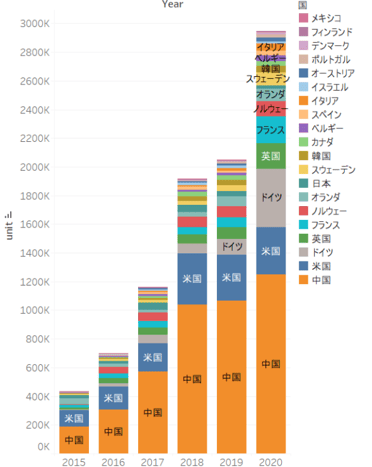
EV Sales by Country
Source: MarkLines
The Key to EV sales? Trends in Subsidies by Country
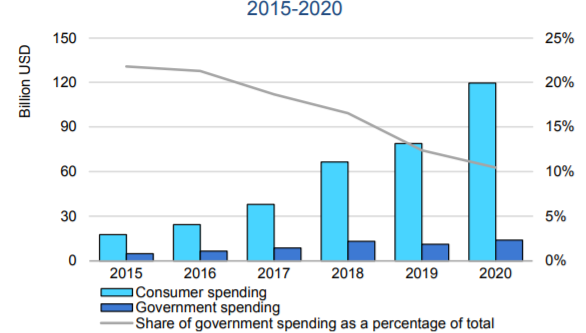
Although the price of EVs has been declining year by year due to the efforts of manufacturers and technological advances, there is no doubt that the subsidy policies for EVs in various countries have had a significant impact on EV sales. In 2020, private EV purchases came to $120 billion, up about 50% from the previous year. Governments spent $14 billion on EV direct purchase incentives and tax exemptions, up about 25% from the previous year.
The higher sales (41%) and the increase in average prices (6%) for private purchases was analyzed. The price increase was attributed to higher new car sales in Europe, where the average price is higher than in Asia. (The global average BEV price in 2020 was about $40,000 and the PHEV price was about $50,000.)
The percentage of government subsidies worldwide has decreased from about 20% in 2015 to 10% in 2020. Government spending increased, mainly in Europe, as many countries implemented incentives that have boosted EV sales as a way of stimulating consumption in response to the pandemic induced recession. In China, government spending has declined as eligibility requirements for incentive programs have tightened.
The subsidy systems show the differences in policies regarding EV sales in each country. In Europe and China, price ceilings have been introduced, meaning that vehicles priced above a certain threshold are not eligible for additional subsidies, whilst in the United States flat-rate subsidies are provided.
The price of BEVs sold in China in 2020 was 3% lower than that in 2019, and the price of PHEVs sold in Europe was 8% lower. This showed that the trend in subsidies has a noticeable impact on sales.
Subsidy policies in each country are as follows (summary as of December 2020).
Outline of subsidy policies in each country
|
Europe |
France: Germany: |
|
China |
The subsidy policy will be extended to 2022 (initially scheduled to end in 2020), and subsidy payments will be reduced by 10% in 2020, 20% in 2021 and 30% |
|
The United States |
The federal government will provide about $800,000 in tax exemptions for the purchase of BEVs, in addition to subsidies and tax exemptions given by many state governments. However, the tax exemptions from the federal government are limited to a cumulative total of 200,000 units per manufacturer, and Tesla and GM have already exceeded the limit and are not eligible for preferential treatment. |
Source: Announcements by governments
Consumer and government spending on electric cars, 2015-2020
Subsidy policies for EVs in various countries have a significant impact on EV sales.
Source: IEA Global EV Outlook 2021
Imports and exports of EVs
The growth in demand for EVs can also be seen in terms of trade volume. In 2020, total exports increased despite the fears that the COVID-19 pandemic would dampen momentum. In addition, as of the end of November 2021, the export volume exceeded that of the previous year. Overall, major countries account for around 35% of total automobile imports and exports in terms of sales. For BEVs only, the figure is around 10%, but the IEA scenario predicts that 25 million EVs will be sold in 2030. Based on this assumption, it is estimated that even if the export ratio of EVs remains at around 10%, a global shift to new energy vehicles with a low environmental impact is expected to progress, with transport demand expected to be around 2.5 million. For example, in August 2021, U.S. President Joe Biden announced a goal of having more than half of all new vehicles being BEVs, PHEVs, and fuel cell vehicles (FCEVs) by 2030. In July, Europe also announced a policy of effectively banning the sale of petrol vehicles in the EU in 2035 with the aim of shifting to EVs. This series of developments suggest that the trend towards increased trade of EVs is likely to continue.
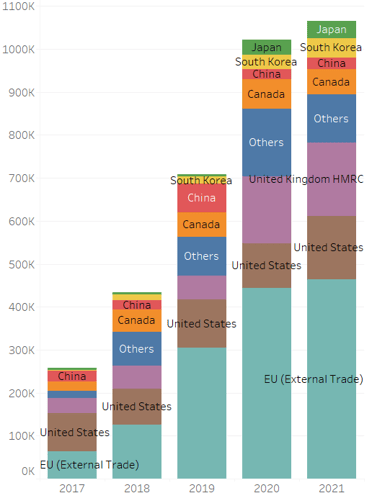
Trends in EV Imports
Source: Global trade atlas
*Sampled HS 870360, HS 870370 and HS 870380 from 23 major countries, since 2017 when data first became available.
EU imports do not include imports within the EU.
Although there is a difference in the time between imports and actual sales, it is assumed here that the year of import coincides with the year of sale.
Main EVs Importers
What would be the share of EV imports in Europe and China, where EV sales are highest and domestic production is possible?
The graph below shows import destinations from Europe. As can be seen, China and the United States are the main sources. Tesla does not currently have a production plant in Europe but maintains a certain number of sales in Europe. This is reflected in imports from Tesla's production sites in the United States and China. There also seems to be a growing number of imports from emerging Chinese manufacturers.
EV Import Volumes and Destinations in Europe
Source: Global trade Atlas
In China, which has the highest sales volume, there is a trend towards local production for local consumption, as the import ratio of EVs is relatively low. Restrictions on foreign investment in new energy vehicles, including EVs, have been removed since 2018, making it possible for foreign capital alone to produce these vehicles in China. For example, the Tesla Shanghai factory is now operating as the first production facility to be funded solely by foreign capital. The annual production capacity of the Shanghai factory has increased to more than 450,000 units per year since the beginning of 2021, bringing the combined annual production capacity of both the United States. and China to more than 1.05 million. Of the approximately 500,000 new vehicles produced by Tesla in 2020, more than 130,000 of them were sold in China, reflecting its growing production and supply capabilities in the region. In addition, since 2019 Chinese government regulations require companies producing, importing, or selling more than 30,000 passenger cars to produce, import, or sell a certain percentage of new energy vehicles. This is likely to be one of the reasons behind the rising production of eco-cars in China.