BLOG
2021.06.01
On 18 March 2021, the first U.S.-China diplomatic meeting was held after the Biden administration. Comments from the two countries after the meeting indicate that the two countries continue to have strained relations, and attention is focused on future the U.S.-China relations. The trade confliction between the U.S. and China has began in July 2018 with the imposition of additional tariffs between the two countries, and although the first phase of the agreement was reached in January 2020, the additional tariffs have yet to be lifted.
In this issue, we will focus on the cargo movement of soybeans among the changes in cargo movement caused by the trade confliction between the U.S. and China.
Soybean production sites and Exports/Imports
Soybeans, a very familiar commodity, has its production areas concentrated in Latin America and North America. The top three countries, Brazil, the U.S. and Argentina, produce 82% of soybeans. Because production areas are far removed from key areas of demand (mainly Asia), there is a demand for transportation to these areas. Currently, China imports about 60% of the total soybeans transported worldwide.
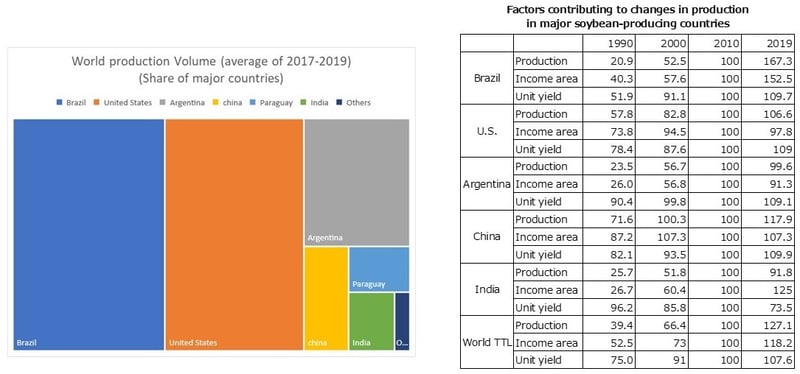
Source: USDA PSD Online data
Use of soybeans
How are imported soybeans used? Soybeans are used not only for human consumption, but also as feed for livestock and cultured fish in the form of soybean meal, a powder made by grinding the soybean after the oil has been squeezed out.
China, which is currently a major importer of soybeans, has been forced to import soybeans from other countries due to its increased demand for soybeans as it has prioritized the planting of staple foods (mainly rice) in preparation for increased domestic demand for grains due to population growth. As a result of the rapid growth in demand for soybeans in China and other countries around the world, agriculture in the Western Hemisphere countries, which are the main production areas, has been significantly structurally altered. At present, in the U.S., soybean acreage now exceeds wheat acreage; and in Brazil, soybean acreage exceeds the sum of all other cereal acreage. Some have indicated that a situation dangerously close to a soybean monoculture is becoming apparent.
In 2012, the share of soybean exports was 48%* for the U.S., followed by Brazil at 32%*, China at 28%*, and Japan and Mexico at about 8% each. In 2018, when trade frictions between the U.S. and China began to intensify, Brazil's share of exports increased significantly to 52%*, surpassing the 33%* share of the U.S., and China's share of imports increased significantly to 60%*, accounting for the majority of imports. China's shift from the U.S. to Brazil as its main destination for imports has had a significant impact on its overall export volume share.
*average of three years before and after this year
Source: Global Trade Atlas
The Impact of the U.S.-China Trade Confliction on China’s soybean imports
Since 2018, the U.S. and China have implemented additional tariffs and other measures on each other in stages, from Phase 1 to Phase 4.
For agricultural products, China imposed a 25% additional tariff on U.S. soybeans in phase 1, which led to a decrease in the volume of exports from the U.S. and a large build-up of inventories.
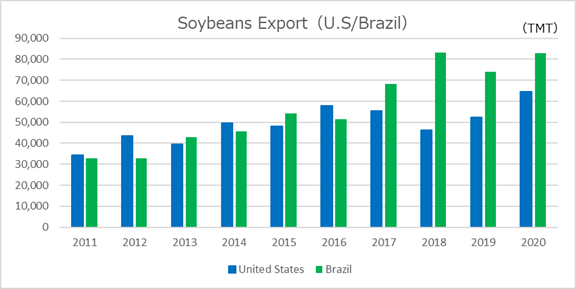
After the U.S. and China imposed additional tariffs on each other, China’s share of soybean imports from third countries (in this case, Brazil) increased, while its share of imports from the U.S. has shrunk. Consequently, Brazil's soybean production has been on the rise since 2018 to meet China's strong demand.
Since 2018, Brazil has surpassed the U.S. in soybean exports to China.
Source: Global Trade Atlas
The U.S.-China Phase I Agreement and its Implementation Status ~ Analysis of soybean imports from the U.S. in 2020
In January 2020, the US and China reached an agreement on the first stage of trade negotiations at the US White House. The content of the agreement was that China would protect intellectual property, open its financial markets, and increase imports from the U.S. over the next two years, while the U.S. would reduce some of the additional tariffs under Section 301 of the Trade Act (but leave most of them unchanged).The main pillar of the agreement is a significant expansion of cargo shipped from the U.S.. China is said to have included in the agreement an increase in imports of goods and services from the U.S. by about 200 billion dollars over two years (compared to 2017). The breakdown of the scale of import expansion reported at the time was $77.7 billion for industrial goods, $52.4 billion for energy such as liquefied natural gas (LNG), and $32 billion for agricultural and livestock products. U.S. exports of goods and services to China are expected to increase by 1.5 times with a supply value of $186.3 billion (compared to 2017).
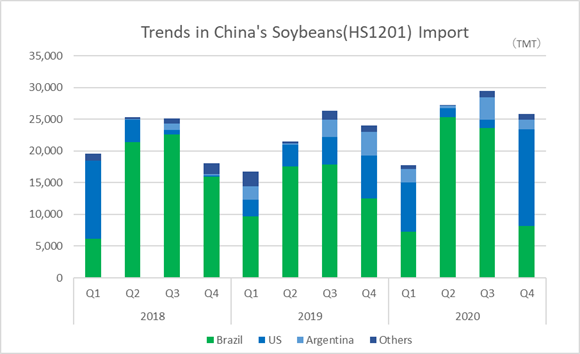
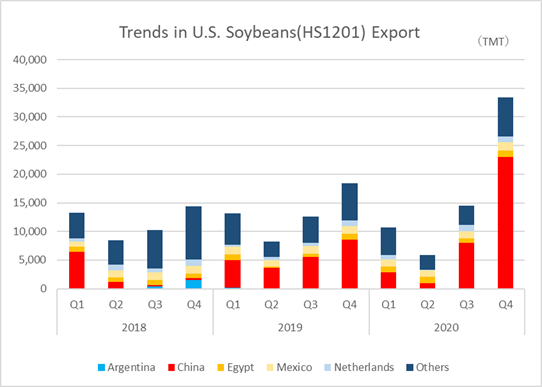
Following this agreement, China has significantly increased imports of U.S. soybeans since the second half of 2020, when the turmoil caused by the COVID-19 had subsided. In 2018, Brazil accounted for 75% of China’s share of soybean imports, but in 2020, Brazil's share dropped to 64%. In the same period, the share of soybean imports from the U.S. was up from 19% to 26% (From Global Trade Atlas).
According to the U.S. customs statistics, China's share of U.S. soybean exports recovered from 18% in 2019 to 54% in 2020, with its exports exceeding 60 million tons. Although the total amount of the first phase agreement is not expected to be reached due to the problems caused by the COVID-19 pandemic, U.S. soybean imports are expected to remain strong.
Source: Global Trade Atlas
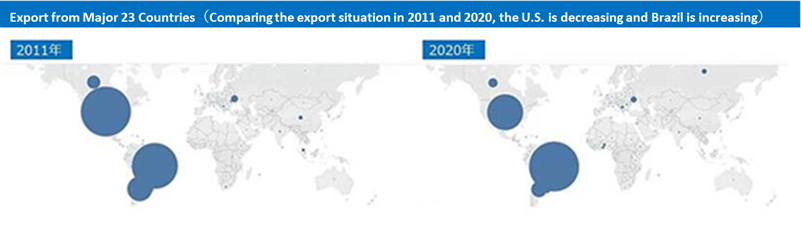
Appendix: Comparison of Exports by country in 2011 and 2020
MOL provides an information platform for dry bulk carrier customers transporting soybeans and other grains, steel raw materials, coal, wood chips, and other materials. The platform enables shippers and other related parties, as well as operators, to safely and centrally share and confirm various information related to marine transportation, including cargo and contract information, vessel schedules, and weather and sea conditions, in real time in a customized form.
~For those who are concerned about optimizing their supply chain management~
You can download the Lighthouse service overview from here:

In addition to its dry bulk carriers, MOL operates one of the world's largest fleets of more than 800 vessels, including tankers for transporting crude oil and petroleum products, LNG carriers for transporting liquefied natural gas, and car carriers for transporting finished vehicles. We will continue to contribute to the global economy through the international maritime transportation of various cargoes such as natural resources, energy, food, raw materials, and finished products, and continue to deliver value to all our stakeholders.