BLOG
2021.09.15
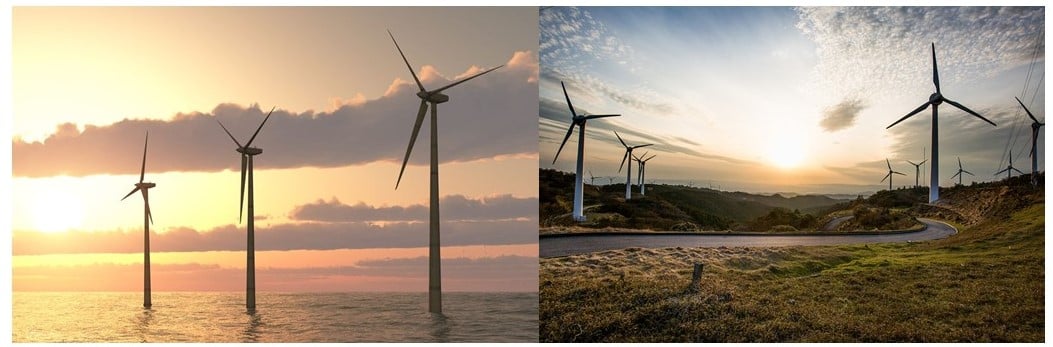
Among the renewable energy sources that are becoming increasingly popular, the use of wind power is growing at a fast rate worldwide. In Europe, the world leader in wind power generation, the spread of offshore wind power, which involves the installation of wind turbines off shore, is rapidly increasing in addition to onshore wind power generation.
This is the series blog of articles on the current state of the business surrounding offshore wind power. In the first part of this blog, we will look at the state of wind power generation around the world and the background to the growing interest in offshore wind power in Europe, which is leading the world.
If you have any questions about this blog or would like to know more, please contact us through contact form.
Wind Power is the largest growth in Power Generation 2010-2020
COVID-19's impact on the energy industry has been enormous. According to BP report "BP Statistical Review of World Energy 2021," the fall in CO2 emissions from energy use has been striking, with emissions falling by over 6% in 2020, the largest decline since World War II. The reduction has been attributed to the lockdown policies put in place worldwide to control the spread of the infection and the economic and daily life activities. At first glance, this may seem like a good thing for the environment, but in order to achieve the climate goals of the Paris Agreement the world will need to reduce its CO2 emissions at the same level as in 2020 for each year over the next 30 years. Even then the decrease will still not be enough to achieve the net zero emissions target that many companies and governments have agreed to.
Renewable energy is said to be the key to achieving this goal. From 2010 to 2019, global renewable energy grew at an average annual growth rate (CAGR) of 5.9%, reaching 52.1% in power generation, which is more than half of the overall growth (others are thermal power generation using fossil fuels). Supported by a wide range of policies implemented by governments, the cost of renewable energy is declining, and its reliability is increasing due to technological developments, which leads to the increase in the amount of renewable energy used. The main driver of the increase in renewable energy was wind power, which increased at a CAGR of 17.1% during the period 2010 to 2019.
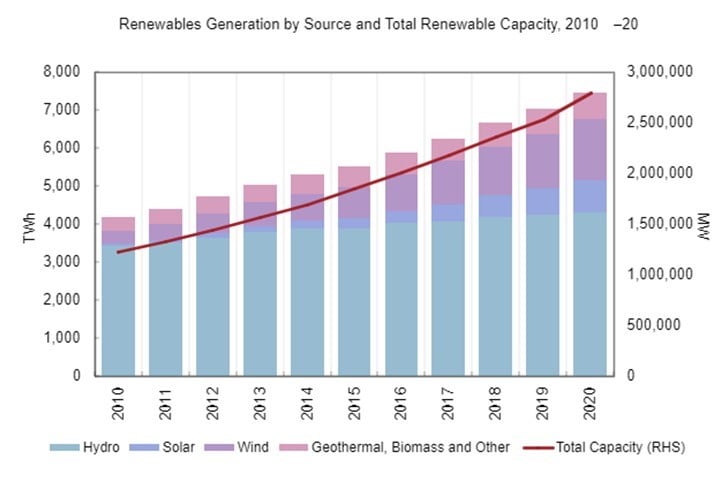
Source: BP Statistical Review 2021, IRENA "Renewable Energy Capacity Statistics 2021"
Despite the fall in overall electricity demand because of COVID-19, power generation from renewable energy (wind, solar, bioenergy and geothermal energy excluding hydroelectricity) recorded its largest ever increase. Over the past five years, renewable energy generation has accounted for around 60% of the growth in global power generation, with wind and solar power more than doubling.
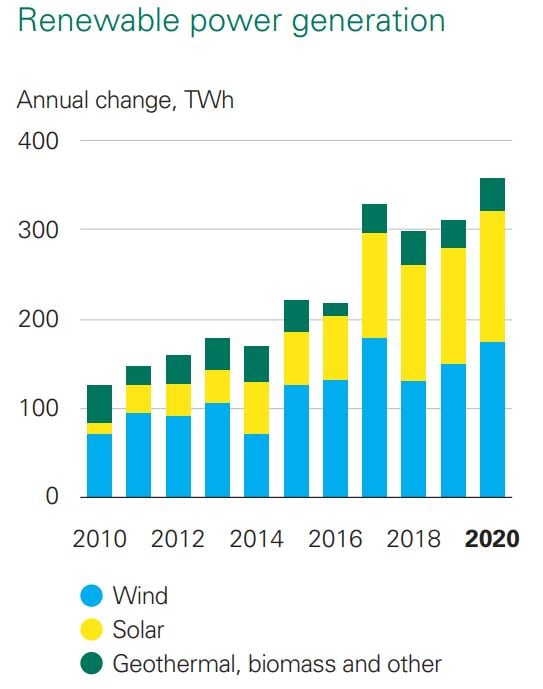 Trends in Renewable power generation 2010 -2020
Source: BP Statistical Review of World Energy 2021
Wind Power in the world
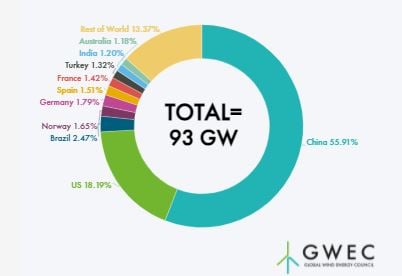
Now, let's take a closer look at wind power, which has been increasing remarkably among renewable energy resources. 1,590 TWh of wind power was generated worldwide in 2020. China was in first place by the country, with the entire country working to expand its renewable energy generation capacity, and it continues to steadily develop renewable energy sources to meet its strong energy demands. In comparison, we can see that Europe as a whole is more active in wind power generation than China.
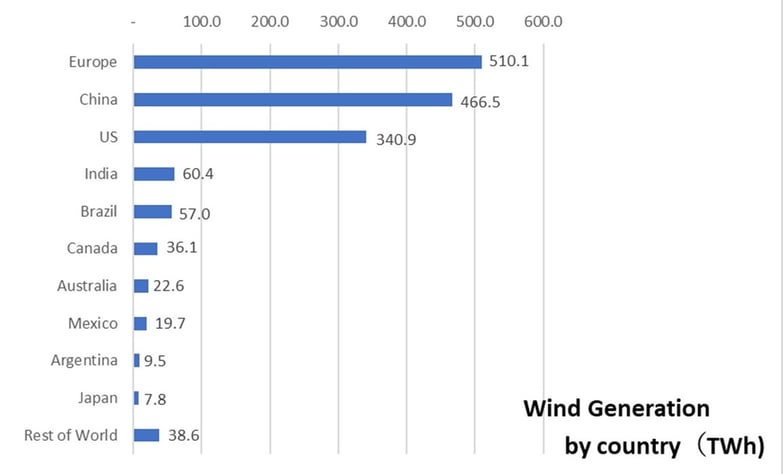
Source: bp Statistical Review of World Energy July 2021
In addition, 93 GW of new wind power capacity was installed in 2020. Despite the impact of COVID-19, this was the second largest amount of new wind power ever installed globally.
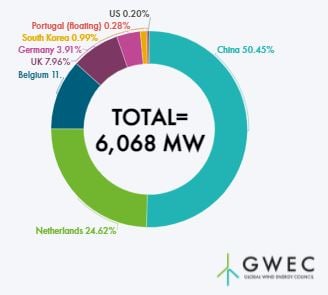 New global offshore wind installations in 2020 (by country)
Source: Global Wind Energy Council (GWEC)
(*) Counted are wind farms with at least two offshore wind turbines in operation
Onshore wind power is now shifting to Offshore
in Europe
In January 2021, the think tank Agora Energiewende (Germany) and Ember (UK) jointly announced that renewable energy for the first time had overtaken fossil-fueled generation. Wind and solar power reportedly now generate one fifth of Europe's electricity requirements. Austria had the highest renewables share at 79%, followed by Denmark (78%) and Sweden (68%).
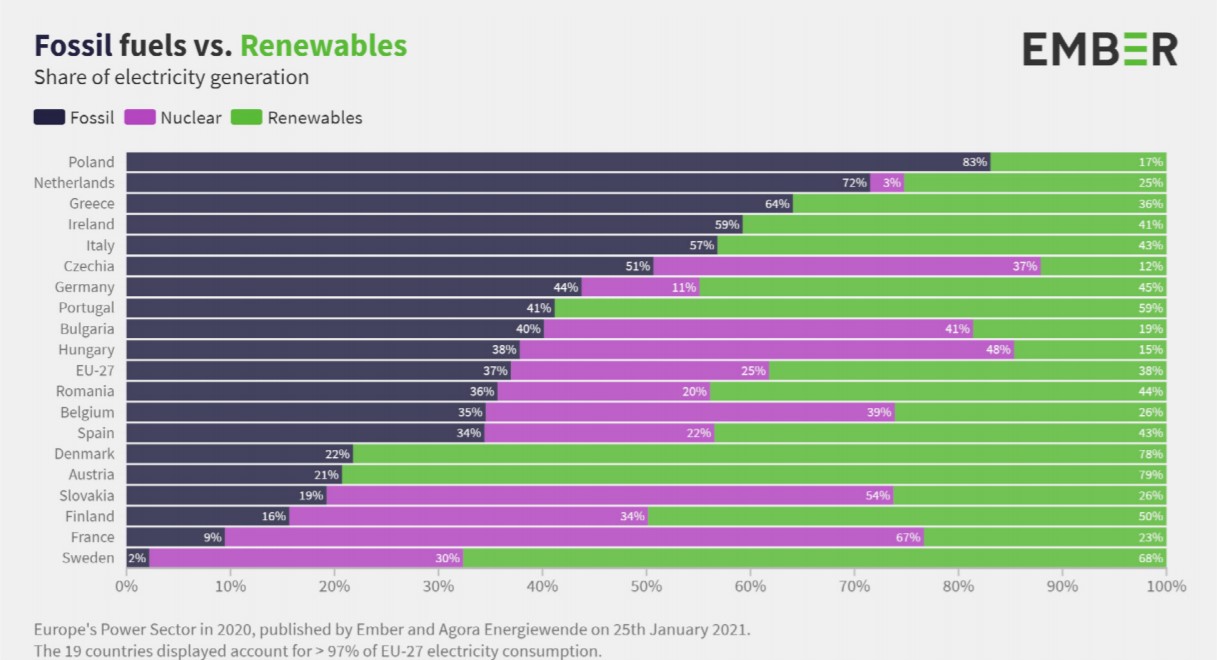
2020 European Power Generation Shares (Fossil Fuels, Nuclear and Renewable Energy)
Source: Agora Energiewende/EMBER The European Power Sector in 2020
In Europe, some countries are facing problems with the introduction of wind power, such as a saturation of suitable onshore sites. As a result, onshore wind power is now shifting to offshore, which has a higher wind capacity. According to WIND EUROPE (headquartered in Brussels), new installations of onshore wind power are still greater than those of offshore wind power overall, but the average annual wind power installation over the past 10 years has been flat at around 10 GW per year. (New onshore wind installations was 11.8 GW in 2020.
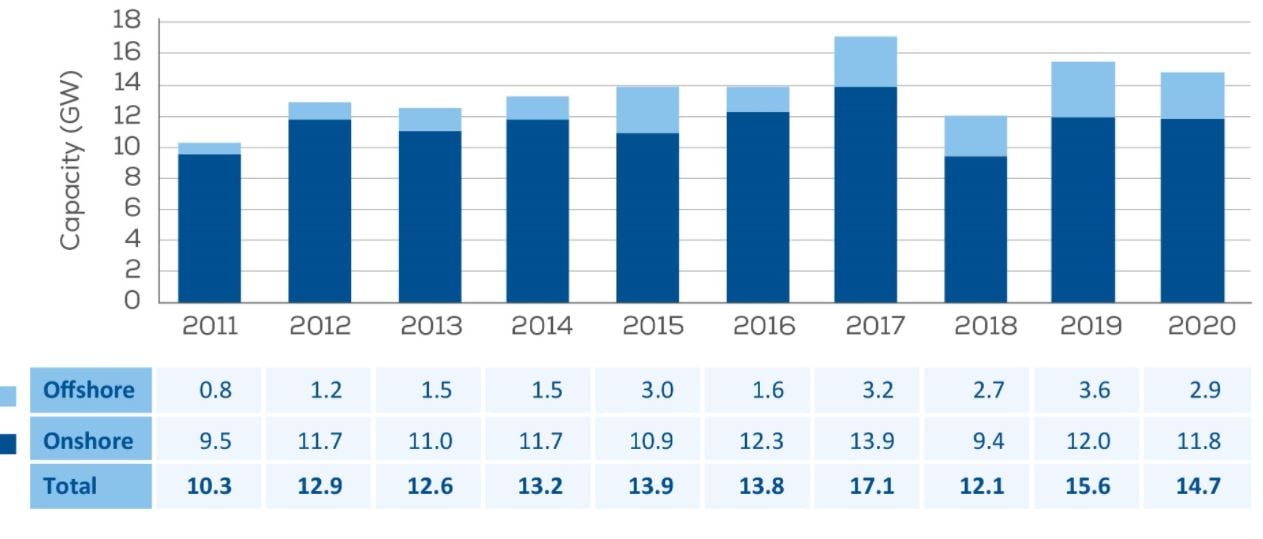
Amount of wind power introduced in Europe (onshore/offshore)
Source: Wind Europe
On the other hand, Europe added 2.9 GW of offshore capacity during 2020, a significant increase from 0.8 GW in 2009. This is expected to accelerate further in the future. Countries such as the UK and Germany have started to introduce offshore wind power, following countries such as the Netherlands, Spain and Belgium who have been actively introducing them over recent years.
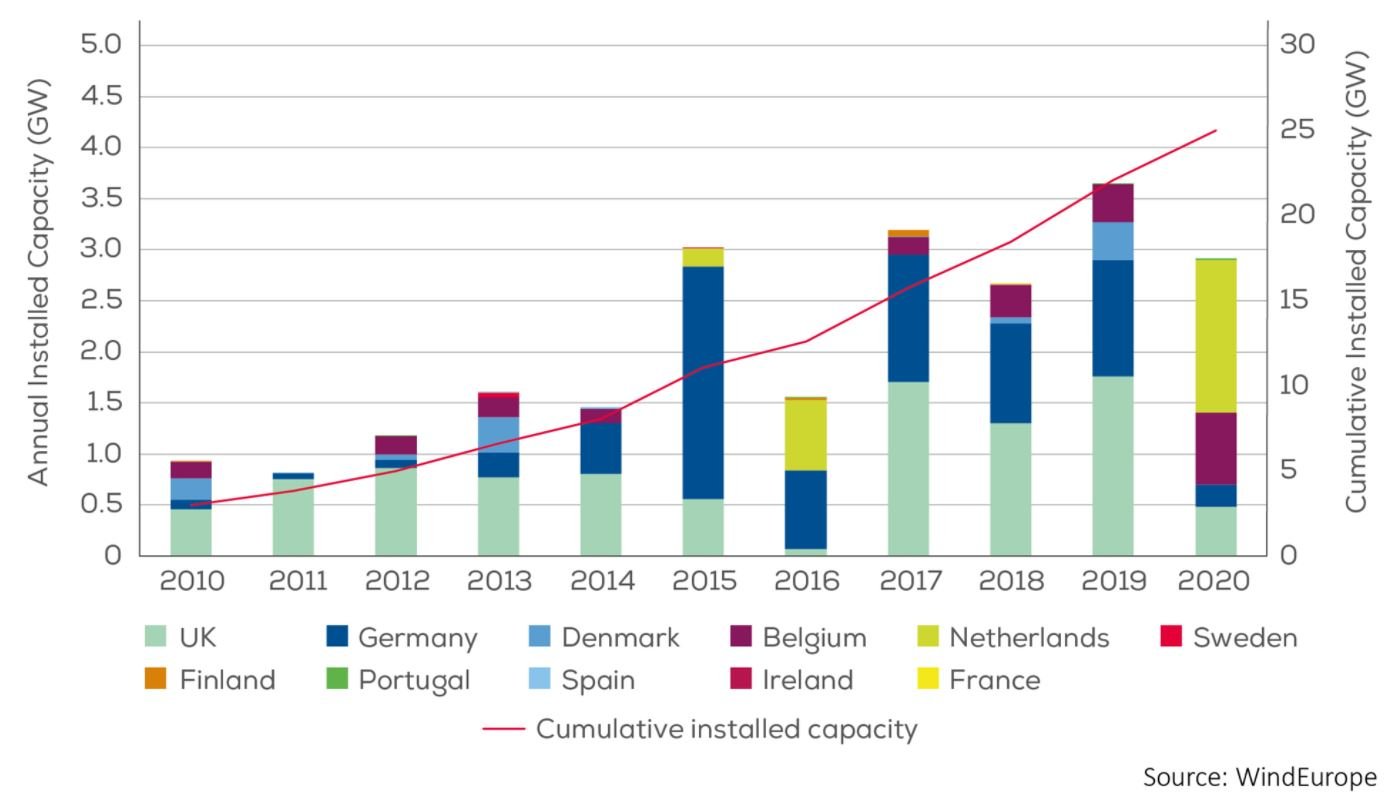
Trends in Offshore Wind power installation in European Countries
Source: Wind Europe ”Offshore Wind in Europe Key trends and statistics 2020”
Importance of Wind Power in Green Recovery
According to the International Energy Agency (IEA), the share of energy sources in Europe in 2020 was about 21% for nuclear power and 43% for renewable energy (Hydropower, bioenergy, wind power, and solar power), of which wind power accounted for about 14%
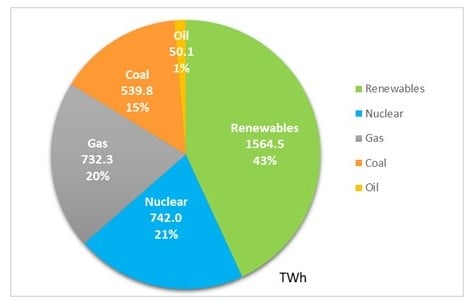 Electricity generation in Europe in 2020 (3628.7 TWh (terawatt-hours))
Source: IEA
The EU has set a goal of net zero greenhouse gas emissions by 2050. To achieve this goal, the electric power sector needs to shift to renewable energy or nuclear energy. In November 2020, the EU announced plans to increase Europe's offshore wind capacity from its current level of 12 GW to at least 60 GW by 2030 and to 300 GW by 2050.
It is said that the public and private sectors will need to invest €800 billion by 2050. The EU has set out a policy of actively encouraging funds to flow to the development of renewable energies, using the EU’s COVID-19 Recovery fund and the European Investment Bank (EIB) financing policy.
Underlying background for the Focus on Offshore Wind in Europe
The key to the widespread adoption of offshore wind power is the selection of suitable locations and the cost of power generation.
In Europe and the North Sea, there are many areas with shallow water extending more than 40 kilometres offshore, which are very suitable for wind farm construction. There are no wind-blocking mountains, buildings, or other obstacles in the area, making it efficient to generate electric power from wind power and also easy to estimate the amount of power generated. One of the reasons for the increase in offshore wind farms is that the cost of offshore wind power generation has become more competitive due to technological advances. As of 2019, the price was about 80 dollars per 1000 kwh, a cost that has been cut in half over the past 10 years. This has accelerated the spread of offshore wind power farms.
Source: METI Agency for Natural Resources and EnergyIn the first part, we introduced the current status of wind power generation, especially in Europe. In the second part, we will discuss the current situation of offshore wind power in Japan, and the Japanese offshore wind power market from a European perspective. Please have a look at the second part.As part of its efforts in the wind power energy business, our group provides a wide range of services to respond to customer issues related to wind power generation, from site environment surveys, design, logistics, construction and O & M.
Please download the service outline below.
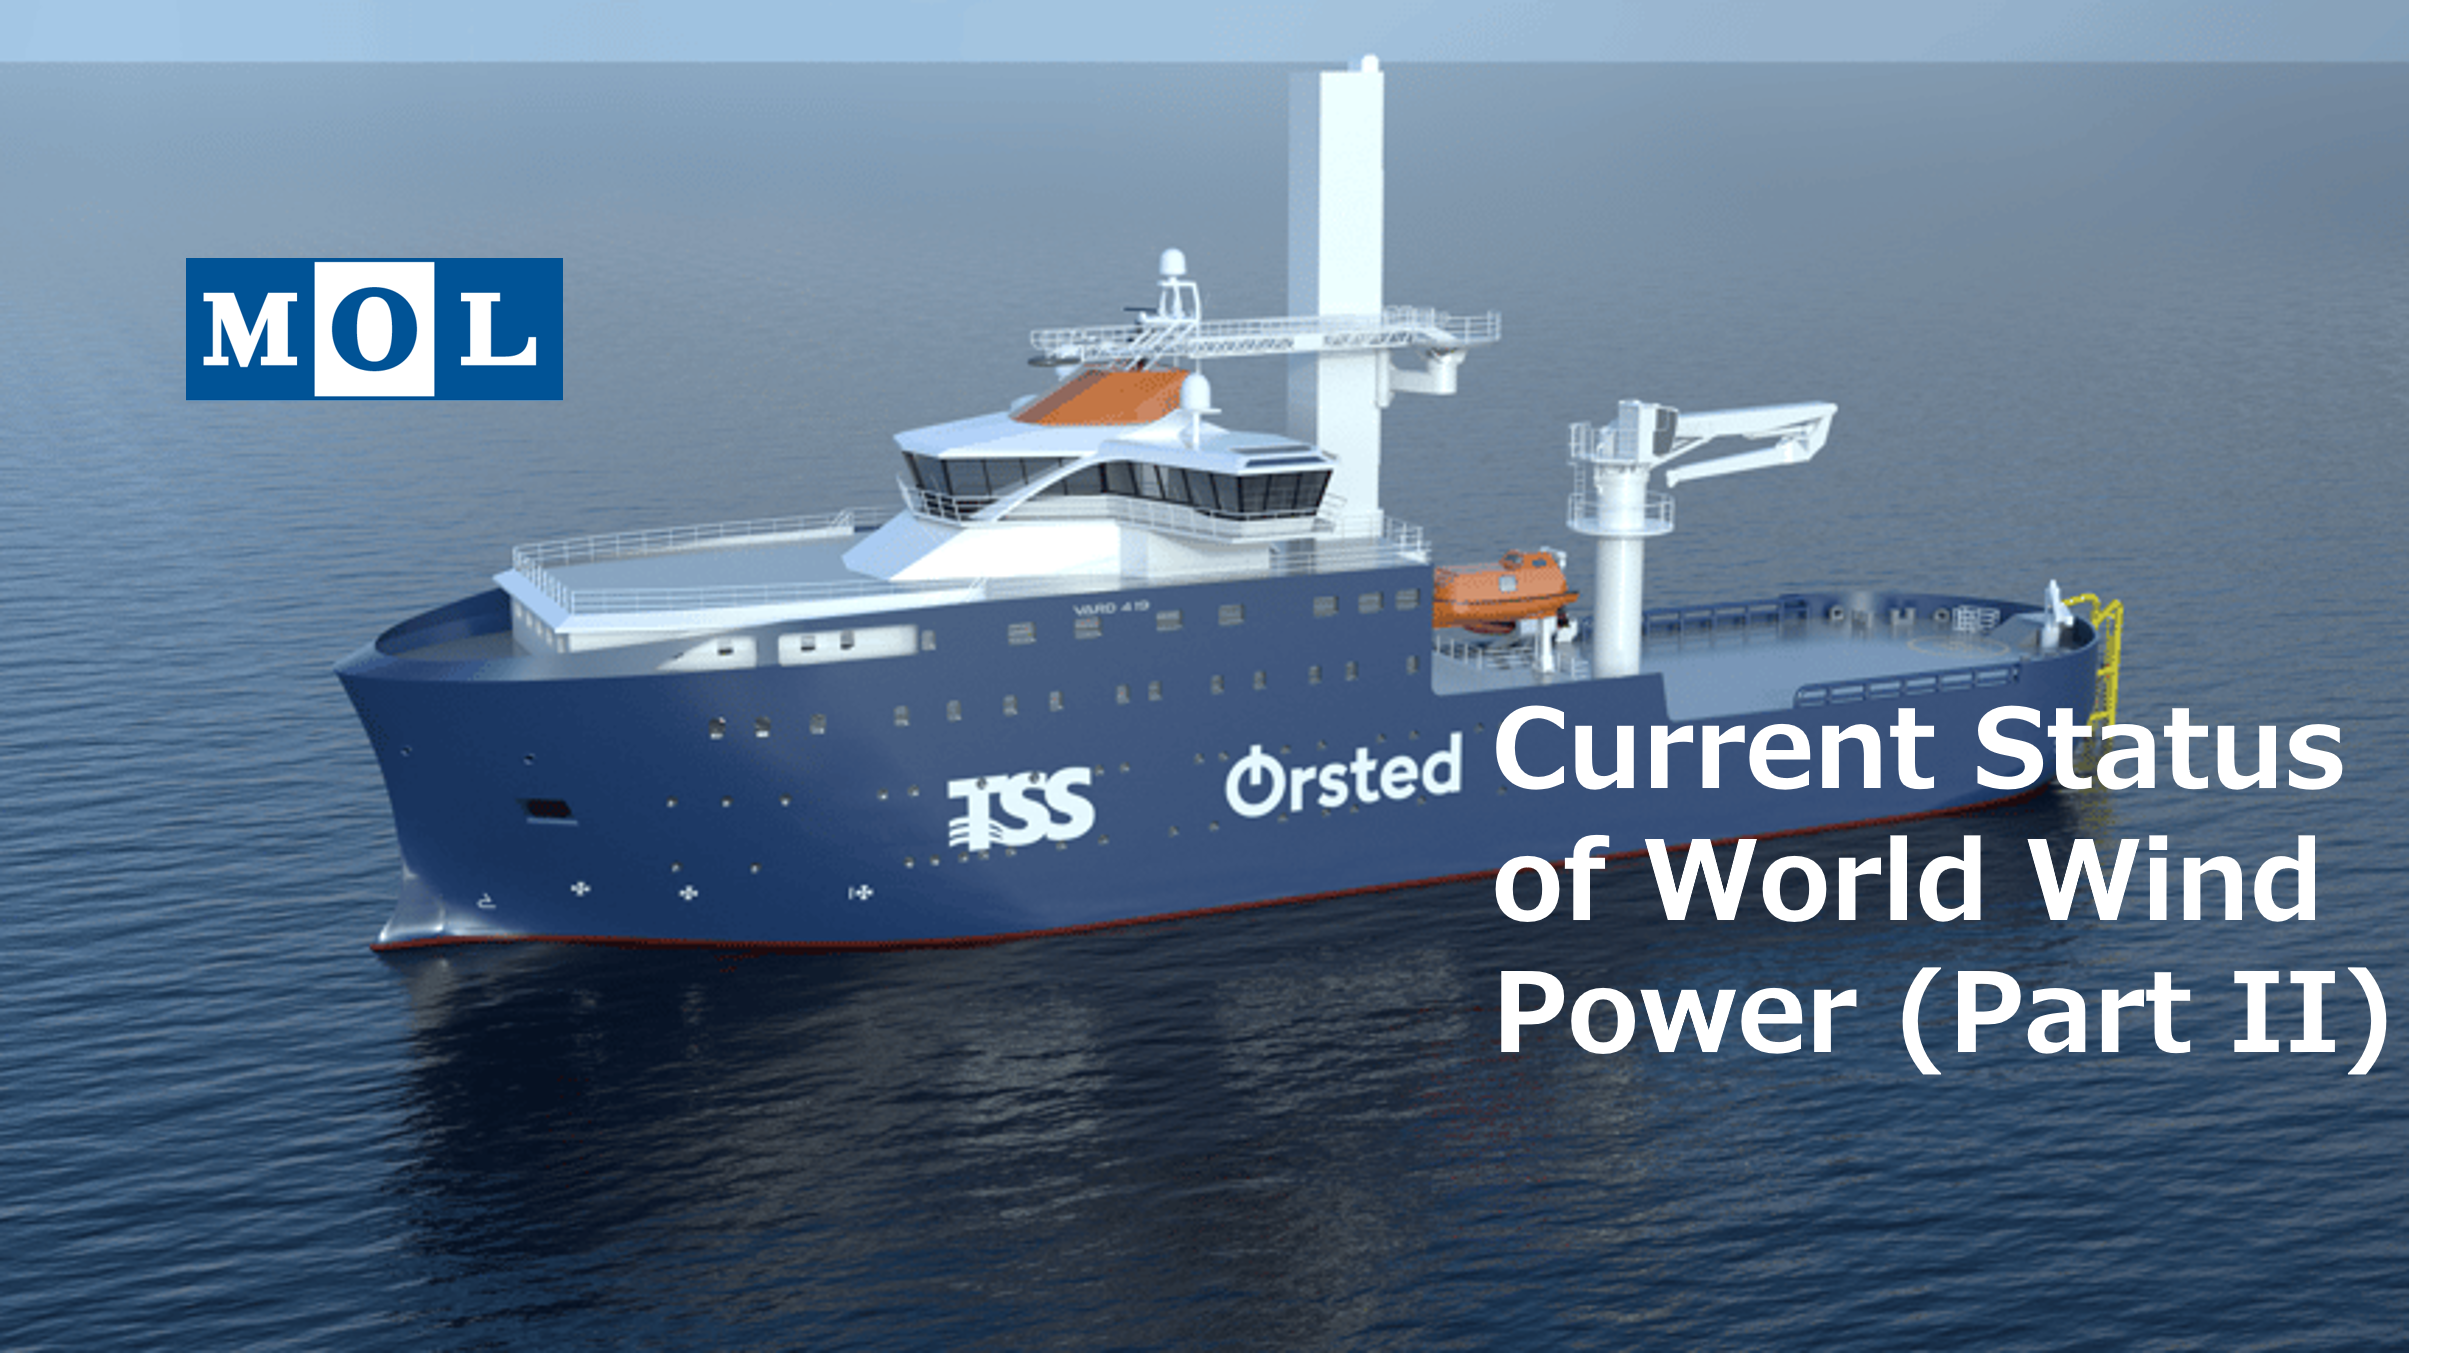
Current Status of World Wind Power (Part II)